Videos

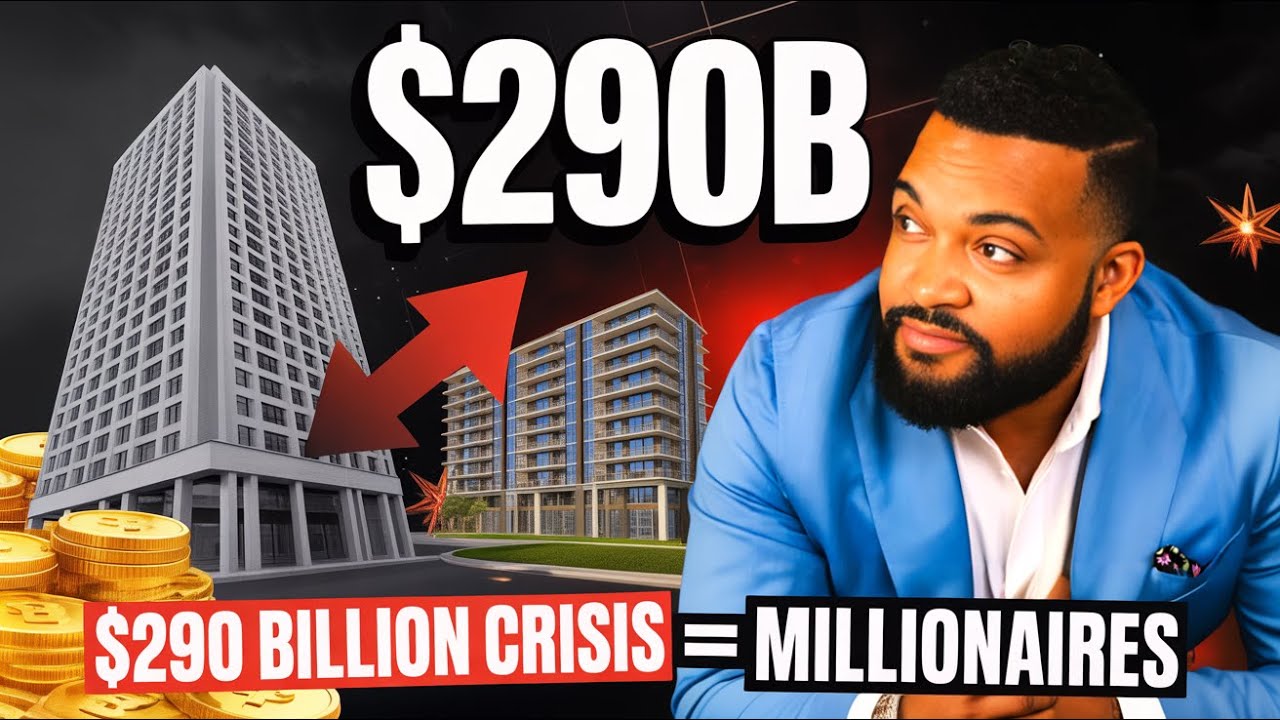
Hampton Roads Multifamily: The $60K Gap Between Buyers & Sellers | Market Reality Check 2025

Hampton Roads Multifamily: The $60K Gap Between Buyers & Sellers | Market Reality Check 2025

There's a massive pricing disconnect destroying multifamily deals in Hampton Roads right now. Sellers want $120K/unit based on 2022 valuations. Buyers are offering $90K based on today's 6.5-7% cap rate requirements. Same properties. Same market. Completely different math.

In this video, I break down exactly where deals are ACTUALLY closing in Norfolk, Virginia Beach, Chesapeake, and Hampton — not where sellers wish they were closing. I'll show you the real cap rates, actual sales comps, and why insurance cost explosions are forcing valuations down 15-20% from peak pricing.

What You'll Learn:✅ Real cap rates by asset class: 6.0% for Class A, 6.4% for Class B/C✅ Actual price per unit: $241K (4-5 Star) vs $183K (3 Star) vs $116K (1-2 Star)✅ Why insurance costs going from $300 to $1,200/unit are crushing NOI✅ Case study: Two properties, same market, $99K/unit price difference✅ Tactical playbook for buyers AND sellers in 2025

Key Timestamps:0:00 - The $60,000 Gap Killing Deals1:30 - Hampton Roads Vacancy Reality (5.5% vs 8.1% National)3:30 - Where Deals Are Actually Closing (Real Comps)7:00 - Case Study: $241K vs $142K Per Unit9:00 - Tactical Takeaways for 2025

Market Data (Q3 2025):

  • Hampton Roads vacancy: 5.5% (better than 8.1% national average)
  • Total sales volume: $785M across 76 transactions (trailing 12 months)
  • Cap rate expansion: 120-140 basis points from 2022 to 2025
  • Annual absorption: 2,256 units (positive demand signal)
  • Insurance impact: $5,000-$7,500/month NOI reduction on 100-unit properties

Core Issue: Sellers anchored to 2022 valuations (5.0-5.5% cap rates) while buyers require 6.5-7.0% cap rates due to higher debt costs and insurance expenses. This creates a $60K/unit valuation gap on identical properties.

Real Comps Analyzed:

  • Banyan Grove Apartments (Virginia Beach): 288 units, $69.5M sale, $241K/unit, low 6% cap
  • Pembroke Lake Apartments (Chesapeake): 300 units, $42.5M sale, $142K/unit

Market Fundamentals: Hampton Roads shows strong fundamentals with vacancy below national average and positive absorption, but pricing MUST reflect current debt environment. Properties ARE trading — just at today's cap rates, not yesterday's.

Whether you're buying, selling, or operating multifamily in Hampton Roads, this video gives you the real numbers you need to underwrite deals in today's market — not yesterday's.

About JustFerg1:Commercial real estate analysis and market intelligence for multifamily investors. Real data. Real deals. No fluff.

📊 Want market reports for your target area? Drop a comment below.
‍

You may also be interested in
How Much Is My Apartment Building Worth in Richmond, Virginia Right Now?

# How Much Is My Apartment Building Worth in Richmond, Virginia Right Now? Right now, Richmond multifamily assets are trading at roughly a 6.2% to 6.4% market cap rate, with recent closed deals ranging from 5.7% on newer Class A product to 6.9% on older 3-Star assets. If your property is generating $500,000 in NOI, that spread is the difference between a $7.2M and an $8.8M valuation — so your actual number depends far more on your asset's class and vintage than on any single "Richmond cap rate" headline. ## Why cap rates vary so much right now Richmond's 4 & 5 Star assets are trading tighter — averaging around 6.0% to 6.2% year-to-date on completed deals — while 3-Star product has traded between 5.3% and 6.7% over the past year, and 1 & 2-Star assets have landed closer to 6.9% to 7.4%. Two comparable-sized properties across town from each other can price a full point apart in cap rate purely because of build quality and unit mix, not location. ## What's actually driving Richmond pricing in 2026 Three things matter more right now than the market-average cap rate: - **Rent growth has stalled.** Asking rents in Richmond rose just 0.9% over the past year — well below the market's 10-year average of 3.7%, as the market digests a wave of new deliveries. That directly caps how aggressive a buyer can underwrite your rent bumps. - **Vacancy is elevated and rising.** Richmond's vacancy rate sits at 8.3%, above the market's historical average of 7.4%, with 4,700 units still under construction (a 4.3% expansion of inventory). Vacancy is expected to tick up further in the second half of 2026 before easing in 2027. - **Transaction volume is thin but pricing is holding.** Only 46 market-rate deals closed in Richmond over the past 12 months, well below the 10-year average of 58, yet dollar volume ($835 million) is actually in line with historical norms — meaning buyers are still paying full pricing for the right assets, they're just being far more selective. ## The variable that changes everything: absorption in your submarket Demand has been heavily concentrated — Western Henrico County, Midlothian, and Downtown Richmond have captured most of the market's net absorption, while other submarkets have seen far less renter demand. Downtown Richmond and the West End currently carry the highest vacancy in the market because of abundant recent completions. If your property sits in one of the in-demand submarkets, you can defend a tighter cap rate than the market average; if it's competing against a wave of new lease-up product nearby, buyers will price in that competition regardless of your own occupancy today. ## The takeaway Your property's value isn't Richmond's average cap rate — it's your specific NOI, divided by the cap rate that matches your building's class and your submarket's supply pipeline, and getting that second number right is where a broker earns their fee. ## What to bring me If you own a 50-400 unit property in Richmond and want an honest read on where it sits in today's range, send me your trailing 12-month operating statement, rent roll, and unit mix. I'll come back with a real number, not a market-average guess. #RichmondMultifamily #VirginiaCommercialRealEstate #ApartmentInvesting

Free Downloads
Fill out the form below and get immediate access to valuable resources!
Thank you for your interest!

Please copy the password below and follow the link.

View Resources
Oops! Something went wrong while submitting the form.